Wednesday, November 16, 2011

Own Your Own LBO: SUPERVALU (SVU)

You don't need to be a private equity fund to do an LBO.  With many highly levered public companies, investors can replicate LBO strategies on their own.  The Soha Group blog is launching the "Own Your Own LBO" series to look at such opportunities, starting with SUPERVALU (NYSE: SVU).


Background


SUPERVALU is retail grocery chain with over 2,500 stores.  The company has made many acquisitions over the years, most notably the $16 billion acquisition of Albertsons in 2006.  Today, SVU's banners include Acme, Albertsons, Cub Foods, Farm Fresh, Hornbacher’s, Jewel-Osco, Lucky, Save-A-Lot, Shaw’s / Star Market, Shop ’n Save, Shoppers Food and pharmacies.  SVU also has a supply chain business for independent grocers.

The Albertsons deal had a big impact on SVU.  SVU paid 6.6x TEV / LTM EBITDA and 20x P/E for Albertsons and took on over $6 billion of debt.  Since then, the company has struggled with operational challenges and an unfavorable macro-economic environment due to the recession and high unemployment.  One key operational challenge has been SVU's high prices compared to competition.  As a result of these headwinds, SVU's top line has been declining (see "Historical Financials" in the model below).  Nonetheless, from 2006 through February 2011, SVU reduced total debt by $2.75 billion and is continuing to reduce debt further.  Some of the cash for debt repayment has come from selling non-core assets, but most is from free cash flow.

SVU appointed a new CEO, Craig Herkert, in 2009.  Prior to joining SVU, he was a senior executive at Wall-Mart and served as CEO of the Americas since 2004.  Before he joined Wal-Mart in 2000, he spent 23 years with Albertsons and its related companies.

SVU's motto is to be "America’s Neighborhood Grocer" and its strategy is focused on hyper-local retailing. It believes in decentralizing certain decisions to give its store managers more say in what brands to put on the shelves.  Nonetheless, SVU maintains a centralized purchasing and management system across all of its banners.  SVU's turnaround plan is called "8 Plays to Win" (see below).

SVU's 5 year stock price chart:

Following a significant fall in the share price over the last few years, SVU's low valuation is compelling.  Despite certain challenges, SVU is still generating a substantial amount of free cash flow, $600 million annually (free cash flow is defined as EBITDA, less CapEx, less interest, less cash tax).  Even after a $74 million annual dividend and a $110 million pension contribution, SVU has ~$400 million of free cash flow annually that can be used to pay down debt (and thereby increase equity value).  In a classic LBO, a private equity fund buys a company that has high debt and then uses the company's cash flow to pay down debt and increase the equity value.  SVU is a similar opportunity.


SVU closed at $7.03 on November 24, 2011 and it is approaching the 52-week low of $6.26.  Currently, it is trading at 4.23 TEV / LTM EBITDA, 5.62 forward P/E (guidance midpoint) and has a 4.98% dividend yield.


Investment Thesis

  • Potential For ~2x and ~20% Return with Conservative Assumptions - Assuming SVU can continue to repay debt, without any growth or any multiple expansion, SVU has the potential to generate a ~2x return over the next 4 years.  
  • Base Case Assumes No Growth - In order to achieve a 2x return in SVU over the next few years, the company does not even need to grow.  In fact, the Base Case even assumes that EBITDA decreases 4% next year.  Due to the economic environment, the return analysis assumes no growth to be conservative.  Should there be growth, then the returns could be higher.
  • Low Valuation - SVU is trading at a low valuation of ~4.2 TEV / LTM EBITDA.  Although the multiples for the retail grocery sector are low in general, ~5x TEV / LTM EBITDA, SVU is trading at a discount to this level.  If  SVU experiences multiple expansion, the stock price should increase to a higher level than assumed in the Base Case.
  • Deleveraging Opportunity - SVU is currently generating ~$600 million of free cash flow (EBITDA, less CapEx, interest and cash tax).  After $74 million in annual dividends and $110 million of annual pension contribution, SVU has ~$400 million for annual debt repayment.  Currently, SVU has a market cap of $1.5 billion and $6.6 billion of net debt.  Because the market cap is 19% of the TEV, the deleveraging will have a significant impact on shareholder value.  An annual debt repayment of $400 is equal to 1/4 the current market cap and should increase the equity value by that amount, assuming the TEV / EBITDA multiple stays the same.
  • Dividend Yield - SVU pays a quarterly dividend of $0.0875, or $0.35 annually.  At the current share price of $7.03, the dividend yield is 4.98% annually.  Considering that the dividend represents a $74 million annual use of cash while the company has ~$600 million of pre-dividend free cash flow, there is good cash flow coverage of the dividend payment.  SVU has substantial debt, but with no large near term maturities, the dividend seems safe.
  • "8 Plays to Win" - The Base Case assumes no operational turnaround.  However, SVU's management has launched a turnaround and growth plan that it calls "8 Plays to Win."  Should management succeed with this program, the company's financials could improve and provide additional upside for the stock price.  Most importantly, SVU needs to focus on lowering prices to remain competitive. SVU is undergoing a shift from relying on promotions to draw customers into their store to a more balanced approach of lower everyday prices, plus promotions.  Should the company succeed in lowering prices in a way that does not have a meaningful impact on margins, the company's revenue decline could end and it may experience growth.  


Risks


  • Continued Revenue Contraction - Revenue has declined for over two years.  SVU has been losing customers, in part, because its pricing has not been competitive.  SVU's management has been been talking about "investing in price," meaning using the reduction in costs to fund a reduction in pricing to become more competitive.  However, SVU may not be successful in reducing price effectively and may continue to lose customers and revenue.  For this reason, the Base Case assumes a 4% decline in EBITDA in 2012.
  • Food Price Inflation - If prices continue to rise and SVU cannot pass on the increase to its customers, its margins will be impacted.
  • Competition - The retail grocery segment is very competitive and, as discussed above, SVU's pricing is currently seen as not competitive.
  • High Debt - Although SVU's debt load seems manageable, especially without upcoming large maturities, the high debt load is a potential risk.
  • Pension - As of February 26, 2011, SVU had a pension obligation of $2.5 billion and pension assets of $1.9 billion.  It appears that the pension was underfunded by $619 million.  In FY 2012, SVU projected a pension and post-retirement benefits contribution of $100 million, rising to $133 million in FY 2016.  SVU is assuming a 7.75% return on its pension assets, which is high.  There is a risk that SVU's pension will not return the projected amount and will be more unfunded than expected.  In this scenario, SVU may need to use additional cash for pension contributions instead of debt repayment.  The models below assume $110 million of annual pension contributions.  SVU's pension disclosure are not sufficient and it is expected that SVU will disclose more data about the pension in the future.  However, this is an important risk factor.


Investment Checklist


  • Why is this security mispriced? 
    • SVU's revenue has been declining for over 2 years, its pricing is not competitive compared to other grocers and it has limited growth opportunities.  Furthermore, it has a high debt load compared to its peers.  As a result the market is currently valuing SVU at a very low valuation.
  • What is the market ignoring about this security?
    • The market is ignoring the cash generating capabilities of SVU, even in a tough environment, which can continue to fund the company's deleveraging.  Even if SVU's multiple does not expand, the deleveraging should be a catalyst for share price appreciation.  In addition, there are growth opportunities that we are excluding from our analysis, which could create additional upside.
  • What are the key drivers for the security?
    • SVU's stock has been declining because of concerns about its above market pricing and concerns of market share loss, combined with concerns over the weak economic environment.
  • What is the downside?
    • The main concern is that SVU cannot become more competitive and turnaround its declining performance.  Should that be the case it may not be able to continue to generate enough cash to continue deleveraging (currently ~$525 million annually).  In such a scenario the dividend may also be cut, but it only represents a $76 million use of cash, so free cash flow would need to drop significantly for the dividend to be cut.  The company has a manageable debt maturity schedule in the near term, but if it experiences cash flow problems over the long term then it  may have difficulty meeting debt obligations.  Additionally, SVU's pension is underfunded and has a seemingly unrealistic return expectation of 7.75%.  Therefore, SVU may need to contribute more to its pension than currently expected.  With an already low multiple, there is little risk of further multiple contraction.
  • What is the upside?
    • If SVU continues to delever at the current run-rate, or even slight lower, then the stock could rise 1.9x in the next 4 years just based on the delveraging (assuming a constant multiple), which is the Base Case in the model.  If SVU experienced multiple expansion to the industry mean and/or growth then the stock could rise further (see High Case).
  • What are the upcoming catalysts?
    • The investment thesis is based on SVU continuing to delever, which will take time and will occur in small increments.  We believe that this process will have a significant impact on the stock in the mid to long term, but may not be apparent in the short term.  In the short term, quarterly financial results may provide a catalyst for the stock.  SVU's top line has been declining and if it halts the decline, the sentiment regarding SVU may change which could act as a catalyst for the stock.


Valuation & Model


The following analysis presents:

  1. Valuation overview
  2. Returns analysis
  3. Historical financials
  4. Comparable companies analysis

The returns analysis presents 3 scenarios.  The return in the Base Case is projected to be a 18% IRR through 2015 and a 1.93x multiple.  The range of returns is from a Low Case multiple of 0.82x to a 34% IRR and 3.20x multiple in the High Case.  We think that the most likely outcome is in the range between the Base Case and the Upside Case, so the expected returns are 1.93x - 3.20x over this time period.


Base Case

In this scenario, SVU's financials continue to decline in 2012.  EBITDA decreases -4% in 2012 compared to LTM September 10, 2011.  EBITDA then stays flat for 2 years and increases 1% in 2015.  Debt repayment, a key driver of returns, decreases to $329 million for the next three years because of the lower projected EBITDA (debt repayment in 2011 is expected to be over $525 million in 2011, so this is a conservative assumptions).  SVU continues to be valued at 4.23x TEV / EBITDA, which is the current multiple.

Through 2015, SVU managed to repay $1.3 billion of debt, which is the main driver for the increase in equity value.  In addition, SVU continues to pay a $0.35 per share annual dividend.

In the Base Case, SVU's stock is projected to increase to $12.16 in 2015.  The cumulative return is $13.56, after adding dividends.  In this scenario, SVU is expected to generate a 1.93x return and a 18% IRR.

Low Case


Although the Base Case is conservative (EBITDA decline in 2012, less debt repayment than current run-rate, no multiple expansion), the Low Case is even more conservative.  It assumes that EBITDA continues to decline each year through 2015 (though at a slower rate each year).  As a result, the debt repayment is even lower.  Furthermore, the TEV / EBITDA multiple is expected to decrease to 4.00x, from the current 4.23x.

In the Low Case, SVU's stock is projected to decrease to $4.38 in 2015.  However, the cumulative return is $5.78, after adding dividends.  In this scenario, SVU is expected to generate a 0.82x return and a -5% IRR.

High Case

The High Case assumes that SVU is able to turn-around its operations.  EBITDA is projected to decline -2% in 2012 (less than -4% in the Base Case) and return to the LTM level in 2015.  As a result, in the High Case SVU can repay $1.5 billion of debt over the period, as opposed to $1.3 billion in the Base Case.  Furthermore, the TEV / EBITDA multiple is projected to expand to 5.0x in 2015.

In the High Case, SVU's stock is projected to increase to $21.12 in 2015.  The total return is $22.52, after adding dividends.  In this scenario, SVU is expected to generate a 3.20x return and a 34% IRR.

NOTE: The model below is meant to present a summary of potential returns and is for illustrative purposes only.  The model is not intended to forecast specific annual financial results.  Additionally, SVU does not report its fiscal year on a calendar year cycle.


Action Plan


The portfolio already has a long position in SVU.  The portfolio is long SVU shares with an average cost basis of $7.25.  Additionally, the portfolio sold January 19, 2013 $7.50 put options on SVU.  We are considering adding to our SVU position.


DISCLOSURE: LONG SVU & LONG SVU THROUGH OPTIONS.

Sunday, October 30, 2011

SemGroup's Saga

After the board of directors of SemGroup Corp. (NYSE: SEMG) rejected an acquisition offer of $24.00 per share in cash from Plains All American Pipeline, L.P. (NYSE: PAA), PAA issued a press release with the news.  SemGroup's stock price shot up 20% from $23.56 to close at $28.27 the day after the announcement.

With the stock up 20% on the news and trading well above the offer price, what should shareholders do now? Sell the stock at around $28 or wait for a higher offer from PAA or another party?  

Let's start with some background.  SemGroup emerged from bankruptcy, which was caused by the trading activities of the previous management team, in November 2010 with a post-bankruptcy equity value set at $25.00 per share.  Although, SemGroup's assets are suited for an MLP structure, SemGroup is structured as a corporation. 

Since emerging from bankruptcy, SemGroup has tried to reorganize its structure and its assets. In June 2011, SemGroup announced that it was planning to create and IPO a subsidiary MLP, Rose Rock, which would contain most of the assets of its SemCrude division, including crude oil storage terminals in Cushing, Oklahoma; a gathering and transportation system in Kansas and Oklahoma; Bakken Shale operations and a Platteville, Colorado crude oil unloading facility. Then, in August 2011, SemGroup announced that it was selling its SemStream business to NGL Energy Partners LP (NYSE: NGL) in exchange for approximately one third of the common units of NGL, a 7.5% interest in NGL's GP and cash.

Following these two transactions, SemGroup would essentially become a holding company with holdings in two MLPs as well as assorted other assets.  

PAA came into the picture on October 6, when it offered to acquire all of SemGroup for $24.00 per share in cash, which was promptly rejected by the board of directors.  Later, PAA disclosed that it had made an offer to acquire SemGroup once before.  In March 2010, PAA offered $17.00 per share in cash for the company.  

It is clear from all of this that there is strategic interest in SemGroup.  PAA has had its sights set on SemGroup for a year-and-a-half and NGL is interested in a large part of the business.  The question remains will a bidding war begin for SemGroup, which could push the stock price up further?

While PAA seems interested in the business, it seems hesitant to pay up for it.  The $17.00 per share bid in March 2010, was well below the $25.00 per share value that emerged in the plan of reorganization. PAA's current $24.00 per share offer "represents a premium of approximately 16% to SemGroup's 10-day average closing price through October 5, 2011, the day immediately prior to PAA's proposal, and a premium of approximately 20% over the 10-day average closing price immediately prior to SemGroup's August 31, 2011 announcement of its pending asset sale to NGL" (PAA's press release).  Still, it was only slightly above the $23.56 share price the day before PAA issued its press release about the bid.  With the stock at that level, SemGroup could not reasonably accept that bid.

Although PAA went public with its intention to acquire SemGroup, it has not yet issued a higher bid.  The press release left the door open for a higher bid in the future, as PAA says:

As a result, we believe you and the SemGroup Board should reconsider our proposal. As we indicated in our previous letter and our discussions with you, we based our proposed value upon public information, and we will consider increasing our proposal if we have full access to SemGroup's non-competitive information and are able to identify additional opportunities to create value. As we also indicated, if preferred by your stockholders, we would consider alternative forms of consideration, including PAA common units...  We are committed to completing a transaction with SemGroup. Given the liquidity and substantial value represented by our proposal, we are confident that a substantial majority of SemGroup's stockholders will support our proposal. We have taken the step of making this letter public to explain directly to your stockholders our proposal, our actions and our commitment. Your refusal to engage with us will only further delay the ability of your stockholders to realize liquidity and receive the substantial value represented by our all-cash proposal.  In order to move forward quickly, we have retained Evercore Partners as our financial advisor and Vinson & Elkins and Morris Nichols as our legal advisors, and they, alongside our senior management, have already completed extensive analysis and due diligence based on publicly available information. We could complete our confirmatory due diligence, finalize the terms of a transaction and make the appropriate regulatory filings very quickly.

By contrast, SemGroup says in a press release:

Consistent with its fiduciary duties, and in consultation with its independent financial and legal advisors, the SemGroup Board previously reviewed the unsolicited proposal and determined that it substantially undervalued the Company. It also noted that the proposal was opportunistic and not compelling as it fails to adequately reflect SemGroup's bright prospects for stockholder value creation.

The quick rejection of the PAA offer, which SemGroup calls "opportunistic," seems to have brushed off PAA.  While PAA still wants to acquire SemGroup, it wants SemGroup's shareholders to encourage the board to pursue a deal before it puts forward another offer.  SemGroup's attack on PAA as being "opportunistic" seems warranted.

Furthermore, SemGroup adopted a poison pill on October 28, 2011 to prevent PAA from making a hostile bid for the company.  This move limits PAA's ability to execute the deal without increasing its bid significantly.

With SemGroup's stock in the $28 range, 17% above PAA's last offer, the market is already pricing in a higher offer from PAA, which PAA isn't yet ready to put on the table since it feels that the board would not pursue it without shareholder pressure.  (NGL,  with a $320 million market cap, is not in a position to make an offer for SemGroup.)

PAA's recent actions leave the door open for a higher bid, but also do not necessarily indicate that one is forthcoming.  Let's look at what PAA can pay for SemGroup:


PAA's offer of $24.00 per share values SemGroup at 11.02x TEV / LTM EBITDA, which is a discount to PAA's EBITDA multiple of 13.40x.  Assuming PAA values SemGroup at the same multiple it is trading at, PAA could pay $30.35 per share for SemGroup based on trailing EBITDA or $36.34 based on the midpoint of SemGroup's EBITDA guidance for 2011.  Considering the synergies that PAA believes that it could generate from the acquisition, PAA could reasonable increase its offer to $30-$35 ($32.50 for discussion purposes) and still not overpay.

While SemGroup still seems undervalued at the current price of $28.30, the risk/reward profile has changed.  In the near term, the stock price will be influenced by the PAA offer, should PAA continue to pursue a deal.  In such a scenario, PAA may raise its bid to the $32.50 range, which would result in approximately $4 per share of upside.

However, if PAA does not pursue a higher offer, more difficult now with the poison pill in place,  SemGroup's stock could fall back to the $24 range where it was trading before the PAA announcement, resulting in approximately $4 per share of downside.

While other factors may emerge in the short term that could positively or negatively impact the stock price, such as a bid from another party, the Rose Rock IPO or completion of the NGL transaction, there seems to be balance of upside and downside potential for the stock.

I decided to sell my holding in SemGroup a bit under $28.  While I originally thought SemGroup's stock would rise higher, I felt that the 20% increase in the stock price due to the PAA offer created a good opportunity to sell.  I may have sold too early and a bidding war may emerge for SemGroup, but I am happy to take my profits and deploy the capital elsewhere with less near term event risk.

Furthermore, I was disappointed with SemGroup's strategic plan, even before the offer.  Although SemGroup's assets were undervalued, especially in the low $20s, the plan to transform SemGroup into a holding company with significant positions in two MLPs seemed strange.  There is a risk that SemGroup would trade at a discount to its holdings in the two MLPs and it may be more attractive to hold each MLP separately (or deploy the capital elsewhere).  I decided not to sell my position in the low $20s because of the upside I believed existed in the assets, but with a sharp increase in the stock price and new dynamics, I am pleased to move on.

If SemGroup's stock falls, I may re-establish my position.  Also, I am long Blueknight Energy Partners L.P. (NASDAQ: BKEP), the former subsidiary of SemGroup's predecessor company that has some similar assets as SemGroup.  I am considering increasing my stake in Blueknight with the proceeds from the sale of the SemGroup position.


DISCLOSURE: I AM LONG SEMG AND BKEP.

Sunday, October 23, 2011

Intel Then and Now

On Friday, Intel's stock price closed the week at $24.03 per share and reached $24.24 on Wednesday.  Sitting above $24, Intel is at a multi-month high, despite the tablets-replacing-PCs story and the gloom and doom coming out of Europe.

Intel last closed above $24 three times in April 2010, reaching a monthly high of $24.22 on April 15, 2010.  Previously, Intel traded above $24 for a short period right before the fall of Lehman Brothers, reaching a monthly high of $24.52 on August 12, 2008.

It is interesting to look at how Intel's fundamentals and valuation have changed since its last two trips above $24.

Date: October 21, 2011
Share price: $24.03
P/E: 10.4x
Dividend yield: 3.50%
Shares sold short: 150.3 million
Revenue: $51.6 billion
EBITDA: $22.6 billion
Net income: $12.8 billion
EPS: $2.31
Net Cash: $8.1 billion

Date: April 15, 2010
Share price: $24.22
P/E: 22.2x
Dividend yield: 2.60%
Shares sold short: 57.5 million
Revenue: $38.3 billion
EBITDA: $16.3 billion
Net income: $6.2 billion
EPS: $1.09
Net cash: $13.8 billion

Date: August 12, 2008
Share price: $24.52
P/E: 20.3x
Dividend yield: 2.28%
Shares sold short: 106.3 million
Revenue: $39.9 billion
EBITDA: $14.9 billion
Net income: $7.1 billion
EPS: $1.21
Net cash: $9.9 billion

(Intel's past results come with the caveat that it acquired McAfee for $7.7 billion in a deal that was announced on August 19, 2010 and closed on February 28, 2011.  At that time, McAfee had $2.0 billion of revenue, $430 million of EBITDA and $168 million of net income.)

Compared with the previous two periods that Intel traded above $24, today Intel's valuation seems more compelling.  Revenue and profits have increased, the P/E multiple is lower and the dividend yield is higher.  Also, net cash has almost returned to the 2008 level, before the McAfee acquisition.

Intel surely faces challenges.  It is relatively weak in tablets and mobile, which are growing fast at the expense of PCs.  End-markets in the US and Europe face economic uncertainty.  Furthermore, it is much harder to grow as the company keeps on getting larger and semis always face cyclicality.  That said, Intel has a few bright spots, especially data centers and emerging markets that are driving its growth.

There is considerable negative sentiment concerning Intel right now.  Short interest has increased from a low of 48 million shares in January to 150 million shares today.  And, 150 million shares sold short is higher than the last two times the stock reached $24.  Goldman Sachs' research analyst James Covello has a Sell rating on the stock since May 18, 2011, when the stock closed at $23.41.

With the stock back to $24, both the bulls and the bears can make a good case for their bets.  There is a lot of uncertainty now with the ongoing European debt saga, so at any moment macro events may shake the market.  However, like several other large caps, Intel's stock price is basically flat for the last decade, despite improving fundamentals.  At some point, multiple contraction will give way to a new driver for the stock.


DISCLOSURE: I AM LONG INTC.

Thursday, April 21, 2011

MIC: After a Long Run, Catalysts for More Upside

With the stock trading at $22.50 per share, up from $14 a year ago and a low of $1 in early 2009, it seems that the easy money has been made; however, there are a few catalysts that will likely drive the stock higher.

First, a bit of history.  Macquarie Infrastructure Company (NYSE: MIC) went public in late 2004 when there was strong appetite for infrastructure companies with high dividend yields.  The stock performed well through 2007 and increased from an IPO price in the mid-20s to a high of $44 per share.  The problems began in the financial crisis of 2008 as some of its operating businesses proved to be more cyclical than expected, especially the aviation services and airport parking segments, and the company was caught with too much debt at the holding company level as well as the subsidiary level.  Business was down, the dividend was cut and the stock slid to as low as $1 per share in early 2009.

Through the financial crisis, MIC made some strategic moves to improve its position.  It offloaded its underperforming and debt-laden Airport Parking subsidiary.  Although Atlantic Aviation (airport services) experienced weakness, MIC did not sell it, instead it renegotiated its lending agreements to provide room to pay down debt from free cash flow.  Furthermore, MIC eliminated its holding company level debt.

After reducing and then suspending its dividend in 2008, MIC announced that it would reinstate it after Q1 2011 with an initial quarterly dividend of $0.20 per share.  At $22.50 per share, this represents a 3.6% annual dividend yield.  However, there is room for the dividend to increase significantly.


I established a position in MIC over time, buying shares in October 2008 at $11.30, December 2008 at $3.52 and, finally, in August 2010 at $13.06.  Basically, I bought shares after the stock declined significantly, near the low and again on the rebound after it made progress on the operating and financial fronts.


BUSINESS OVERVIEW

MIC is a holding company in the infrastructure space with four distinct businesses.  The largest business, IMTT (MIC owns 50%) is currently in growth mode and performing very well.  The second largest business, Atlantic Aviation, has a high debt load, which it is reducing through free cash flow.  The other two businesses, District Energy and The Gas Company (Hawaii) are defensive businesses that have very little impact from the business cycle.

MIC's initial $0.20 quarterly dividend is being funded mainly by cash flow from District Energy and The Gas Company.  IMTT is generating enough cash flow to provide for a dividend; however, there is a conflict between MIC and the other shareholder about IMTT's dividend policy.  MIC wants IMTT to use some of the free cash flow to fund dividends, but the other shareholder is blocking this.  An arbitration process will settle this dispute.  However, at some point, IMTT will be begin to issue dividends to MIC, which MIC will dividend out to its shareholders.  Atlantic Aviation is currently not in a position to issue dividends because of its high debt load and prohibitive debt covenants.  But, Atlantic Aviation is generating free cash flow and reducing debt.

Already, MIC's management announced that it intends to increase its quarterly dividend to $0.375 per share.  At $22.50 per share, this represents a 6.7% dividend yield.

Before going into the valuation, the following is a brief overview of MIC's businesses.

IMTT
2010 Revenue: $557 million
2010 EBITDA: $237 million
2010 FCF: $147 million
Debt / 2010 EBITDA: 2.77x
Revenue growth: 61%
EBITDA margin: 43%
FCF margin: 26%
MIC's ownership: 50%

IMTT is MIC largest segment (though MIC owns 50% of IMTT). IMTT owns and operates bulk liquid storage terminals in the US and Canada. The company has 42 million barrels of storage capacity. It mainly stores refined petroleum, not crude. In addition, IMTT has an environmental services subsidiary, Oil Mop, which was very active in the Gulf of Mexico oil spill cleanup in 2010.

MIC's management projects $200 million of EBITDA for IMTT in 2011. Although this is down from 2010, 2010 EBITDA benefited from the increased activity of Oil Mop due to the Gulf of Mexico oil spill. Oil Mop generated gross profit of $69 million in 2010 and is projected to generate $5 million gross profit in 2011.  IMTT has a strong pipeline of growth projects which are expected to come online in the next couple of years.

Atlantic Aviation
2010 Revenue: $573 million
2010 EBITDA: $117 million
2010 FCF: $48 million
Debt / 2010 EBITDA: 6.88x
Revenue growth: 18%
EBITDA margin: 20%
FCF margin: 8%
MIC's ownership: 100%

Atlantic Aviation operates the largest network of fixed based operations (FBOs) in the US. FBOs serve private and corporate jets with terminal operations, refueling, de-icing, aircraft parking and hangarage.

Atalantic Aviation is highly levered; however, it is actively reducing its debt. In 2010, the company reduced its debt by $55 million and is continuing to delever in 2011. Before the financial crisis, Atlantic Aviation distributed dividends to MIC, which were passed on to MIC's shareholders. With 6.88x leverage, Atlantic Aviation cannot issue dividends under its credit agreements. However, Atlantic Aviation is using FCF to de-lever and expects to exit the dividend lockup in 4Q 2011.

The Gas Company
2010 Revenue: $85 million
2010 EBITDA: $44 million
2010 FCF: $25 million
Debt / 2010 EBITDA: 3.60x
Revenue growth: 8%
EBITDA margin: 52%
FCF margin: 30%
MIC ownership: 100%

The Gas Company (TGC) is a producer and distributor of synthetic natural gas (SNG) and a distributor of liquefied petroleum gas (LPG) on the six major islands of Hawaii. TGC owns and operates an SNG plant and more than 1,000 miles of pipeline serving over 35,000 utility customers (businesses and households). The business serves an additional 33,000 non-utility customers via on-site propane tanks or portable gas cylinders.

The Gas Company is a solid unit that generates $25 million per year in FCF, or $0.55 per MIC shares. The company has limited growth opportunities and downside risk.

District Energy
2010 Revenue: $57 million
2010 EBITDA: $23 million
2010 FCF: $15 million
Debt / 2010 EBITDA: 7.44x
Revenue growth: 17%
EBITDA margin: 40%
FCF margin: 26%
MIC ownership: 50.01%

The district energy business includes Thermal Chicago which operates the largest district cooling system in the United States. Thermal Chicago provides chilled water under long-term contracts to over 100 customers in Chicago, Illinois. The business also provides district heating and cooling to a hotel/casino complex and adjacent shopping mall in Las Vegas, Nevada.

Like the Gas Company, District Energy is solid unit with limited volatility. District Energy generates $15 million of annual FCF, half of which is attributable is attributable to MIC and translates into $0.16 per MIC shares.

VALUATION


Currently, MIC is trading at $22.50 per share.  My target price short term target price for MIC is $27, which represents a 20% increase.  Longer term, I believe that MIC will reach $37.50, which represents 67% upside.

MIC's accounting is complicated and its financial statements do not clearly reflect its actual performance.  Since MIC owns 50% of IMTT and 50.01% of District Energy, its financial statements make adjustments for the consolidation of these segments.

I use two valuation models for MIC.  Valuation A is a dividend yield analysis and Valuation B is a sum-of-the parts analysis.


Valuation A above looks at the dividend yield in various scenarios:

  • Current - MIC has announced a $0.20 per share quarterly dividend ($0.80 annually).  At the current share price of $22.50, this implies a 3.6% dividend yield.  This dividend yield is below the yield of the comps (using mainly IMTT comps, since IMTT comprises the majority of MIC's value).  However, the yield is low because MIC has announced its intentions to increase the dividend to $0.375 per share quarterly ($1.50 annually) by the end of the year.  The $0.80 annual dividend is derived mainly from cash flow from the Gas Company and District Energy, since Atlantic Aviation is using cash flow to delever and IMTT's other shareholders are currently blocking dividend distributions.  Over time, MIC's dividend will increase with contributions from all four segments.
  • Scenario I - As mentioned above, MIC intends to reach a $1.50 annual dividend rate by the end of this year.  Assuming a 6% dividend yield, in-line with IMTT's comps, then the implied share price is $25.00.  With the shares trading at $22.50, the market seems to be factoring in these developments.  
  • Scenario II - Despite MIC's intention to raise the dividend to $1.50 per share in the short term, MIC is generating significantly more cash flow, which will provide for future dividend increases.  MIC's management has announced that it projects $3.00 per share of cash flow in 2011.  As mentioned above, some of this cash flow is trapped at the operating company level (Atlantic Aviation is using FCF to delever and IMTT's distributions are being worked out).  However, in 2012/2013, Atlantic Aviation should resume distributing cash to MIC and IMTT's shareholder issues should be resolved by then.  At that point, IMTT should have, at least, $3.00 per share of free cash at its disposal, before assuming growth.  Although it will probably not use all of its free cash for dividends, assuming a 6% yield on $3.00 per share of FCF implies a $50.00 share price.
  • Scenario III - Although MIC's management is forecasting $3.00 per share of FCF in 2011, it is bringing forward certain CapEx projects that will reduce FCF to capture an accelerated depreciation tax benefit.  According to MIC's management, the accleration of CapEx in 2011 is going to reduce FCF by $0.25 per share.  Therefore, on a run-rate basis, MIC could generate $3.25 per share from its current operations.  Assuming a 6% dividend yield, as described above, implies a share price of $54.17.
Valuation B is a sum-of-the-parts analysis of MIC.  According to this valuation method, 79% of MIC's value is ascribed to IMTT and only 1% to Atlantic Aviation.  Over time, Atlantic Aviation's value should increase as it reduces debt and continues to benefit from cyclical trends.  Atlantic Aviation is a key driver of future growth, but is essentially treated as option value for this analysis.
  • IMTT - The analysis assumes $200 million of 2011 EBITDA, which is lower than the $237 million of 2010 EBITDA because of the one-time benefits from the cleanup of the BP oil spill.  The analysis uses 2010 EBITDA for the other segments, but in IMTT's case, to be conservative, it uses 2011 EBITDA, which is expected to be lower.  A 13.0x TEV / EBITDA multiple is below the 14.3x multiple for the comps.
  • Atlantic Aviation - The analysis is based on 2010 EBITDA of $117 million.  Management forcasts $120-$130 million of EBITDA for 2011, but the lower number is used to be conservative.  Furthermore, Atlantic Aviation is paying off debt, but the analysis uses the debt balance at December 31, 2010.  Atlantic Aviation's closest comp is trading at 8.3x TEV / EBITDA, but the analysis uses a 7x multiple for Atlantic Aviation.  There is upside in this analysis for future growth, reduced debt and a higher multiple.
  • The Gas Company - Because of the limited growth opportunities of the business, the analysis is based on $44 million of 2010 EBITDA.  The 11.0x TEV / EBITDA multiple is a discount to the average multiple of the comps of 13.0x
  • District Energy - Like the Gas Company, the 2010 figures are used with an 11x EBITDA multiple.
  • MIC Holding Company - The holding company generated -$11.3 million of EBITDA in 2010, which is multiplied by a 10.5x EBITDA multiple (the average of the other segments).
The following is the comps analysis:


Based on the sum-of-the-parts analysis, the target share price is $27.06.  However, there is hidden value at this price because it assumes almost no value for Atlantic Aviation.  As Atlantic Aviation continues to reduce debt, its equity value will grow and will increasingly provide a positive impact on MIC.

In the short term, I believe that MIC will reach $27 per share, which is the value from the sum-of-the-parts analysis.  In the mid term, I expect MIC to reach $37.50 per share, which is the average of scenarios I & II in the dividend yield analysis: $2.25 per share dividend (133% FCF coverage with $3.00 FCF per share) and a 6% dividend yield.


CATALYSTS

There are a number of short term and long term catalysts for MIC.  The main drivers for the stock will come from IMTT and Atlantic Aviation:

IMTT

  • Dividends - In the next year, MIC should resolve its disagreement with the other MITT shareholders, which could lead to increased dividends from IMTT.
  • Growth - IMTT has $125 million of growth projects under way, which are expects to generate $21 million of EBITDA.  In addition, it has a pipeline for more projects.
Atlantic Aviation
  • Deleveraging - Atlantic Aviation still has a high level of debt.  As it continues to pay down its debt, its equity value will increase.
  • Dividends - Atlantic Aviation may resume distributions to MIC by the end of 2011 or 2012 based on the pace of its debt repayments.
RISKS

There are a number of key risks to the opportunity in MIC's shares:

  • Economic risks - MIC is an infrastructure company and its performance is tied to the performance of the overall economy.  A recession could reduce the demand and price of oil, which will have an indirect impact on IMTT.  Furthermore, a downturn would have a more severe impact on Atlantic Aviation as private jet use decreases.  
  • Leverage - MIC's operating businesses are all leverage and the debt of Atlantic Aviation is especially high.  
  • Interest rates - Historically, MIC appealed to shareholders because of its dividend yield.  Should interest rates rise significantly, then other income generating securities may offer shareholders more attractive opportunities.


DISCLOSURE: I AM LONG MIC.

Saturday, February 26, 2011

MGM Turnaround Story: Can the Stock Rise 2x?

MGM reported Q4 and FY 2010 results on February 14, 2010, which were short of street estimates.  2010 was not a good year for the company as it generated approximately $1 billion of EBITDA, which is down from over $2 billion of EBITDA at its peak in 2006 and 2007.

With the 2010 results out of the way, my attention turns to MGM's multi-year turnaround story.  After the company's financial performance suffered during the recession of 2008 and 2009 and its aftermath, MGM is experiencing some problems, but now showing positive signs for future growth.

With only $1 billion of annual EBITDA, MGM has a free cash flow problem.  Annual CapEx is in the $200-$300 million range.  Furthermore, MGM has $11.5 billion of net debt, plus 50% of the CityCenter and MGM Macau of approximately $2 billion. Its interest expense for 2010 was $1.1 billion, excluding interest at CityCenter.

However, MGM is in the process of a turnaround and its EBITDA should grow from $1 billion back up to the pre-crisis range of $2 billion. EBITDA growth will be driven mainly by an improving economy, which will bring vacation and convention visitors back to Las Vegas.  Given MGM's operational and financial leverage, the company is an attractive play on the rebounding economy.

Furthermore, MGM launched two new operations since the last peak that should generate significant EBITDA and shareholder value.  In late 2009, MGM launched CityCenter, a mammoth new casino and resort project in Las Vegas.  CityCenter generated $840 million of revenue and $70 million of EBITDA in 2010, its first year of operations.  When it reaches its full potential, it should generate over $1 billion of revenue with a >25% EBITDA margin (Bellagio alone generated over $1 billion of revenue and $270 million of EBITDA in 2010).  Additionally, MGM is in the process of doing an IPO for MGM Macau, which should generate shareholder value in the short term.

Importantly, on the recent conference call MGM's management gave positive guidance and expectations for 2011.  The following are a few quotes from the call:

Positives
  • Visitor Growth (I) - "Visitor growth was about 3%, and for [2011] the LVCVA is predicting another 3% increase. We think there is upside to those numbers based on increased scheduled flights into Las Vegas, a stronger convention calendar, and the early booking pace that we are seeing already this year, particularly in the year for the year."
  • Visitor Growth (II) - "On the Casino side, we continue to see strength in the international play. In fact, we had another all-time record in the city and for our Strip properties in 2010 including ARIA in terms of international volume."
  • Visitor Growth (III) - "We're in the tail end of Chinese New Years and we've seen very strong volumes here in Las Vegas. In fact, in one metric we're looking at -- we flew about 15% more customers into Las Vegas this year than last, all of our suite product has been fully occupied through the whole period with high-volume and high-value guests."
  • Conventions - "Looking at it for the full year, we have approximately 1.6 million convention room nights on the books [NOTE: MGM has ~12 million annual room nights] which is a double digit increase from the same time leading into last year. And we're still seeing strong bookings, as I said, for in-the-year, for-the-year."
  • RevPAR (I) - "And the convention mix helps us drive much better revenue, and reason why we believe REVPAR will be up all year in 2011 for our company."
  • RevPAR (II) - "Our strip REVPAR in the quarter was down 2% excluding resort fees. Had we included resort fees in the quarter, our REVPAR would have been up approximately 2% in the quarter."
  • RevPAR (III) - "Beginning in the first quarter, we will be including resort revenue which is a change for us in our hotel revenues, ADRs and REVPAR to be consistent with industry practice, and to give you a sense for where we are forecasting our REVPAR for the first quarter, we believe that REVPAR will be up at least 10% in the first quarter including resort fees."
  • RevPAR (IV) - "I don't think, for example, we could have deployed the resort fee strategy two years ago and be as successful as we are right now. That effectively is a price increase and it has been very well-received and has had a big impact on revenue for us and will this year."
Negatives
  • Spend - "One area that was challenging last year is customer spend, though even there, we're seeing some improvements at least in the luxury segments. We're beginning to see convention customers actually renting out some of our other amenities like nightclubs and restaurants and the Beach at Mandalay Bay and even the MGM Grand Garden. That has not occurred since back in 2008. In addition, we see that improved customer spend around our other special events like fights and concerts and holidays, which also bodes well for improvement this year."
On the positive side, MGM is expecting over 3% growth in visitors to Las Vegas and, as the largest hotel and casino company in Las Vegas, MGM should experience a similar increase.  Not only will visitation increase, but conventions bookings are up, which is a boost to both occupancy and rates.  Furthermore, MGM has seen an increase in RevPAR, due, in part, to the launch of its resort fee, which is effectively a price increase.  

In a recent investor presentation from February 16, 2010, MGM explained its operating leverage and how such increases translate into EBITDA.  Assuming 90% occupancy:
  • 1% increase in occupancy = Approximately $40 million of EBITDA
  • $1 incremental rate increase = Approximately $10 million EBITDA
  • $5 increase in RevPOR = $40 million EBITDA
Therefore, a 3% increase in occupancy could generate an additional $120 million of EBITDA.  A 10% increase in RevPAR could generate another $100 million of EBITDA (RevPAR is in the $50-$200 million range depending on the property, so a 10% increase on $100 of RevPAR would generate an additional $10 of RevPAR, which translates into $100 million of EBITDA).  The rate increase would likely happen gradually over the year, so the final result may be a bit less.

These are rough estimates, but based on management's projections, MGM could add $200 million of EBITDA in 2011, before additional increase in EBITDA from CityCenter and MGM Macau.  So, 2011 EBITDA could reach at least $1.2 billion and likely higher (over 20% growth y-o-y).  I believe that over the next 3-5 years, EBITDA will continue to grow and approach $2 billion.

MGM's balance sheet and valuation still remain an issue.  Currently, the company has $11.5 billion of net debt, plus approximately $1 billion of its share of off-balance sheet debt (mostly from CityCenter and MGM Macau).  With $1 billion of EBITDA, the company is not generating enough free cash flow to pay down debt because interest expense is over $1 billion annually and CapEx is in the $200-$300 million range.  However, if MGM reached $1.2 billion of EBITDA in 2011, I expect it to be in a position to generate free cash flow to pay down debt in 1-2 years.  Having restructured its balance sheet in 2010 (and CityCenter's balance sheet), it is not facing near term debt maturities and has time to grow its free cash flow.  

Furthermore, MGM has two short term liquidity opportunities.  It is in the process of selling its share of the Borgata in Atlantic City.  Already, the trust controlling MGM's Atlantic City holdings has almost $200 million and the amount will increase with the proceeds of the Borgata sale.  In total, MGM should receive a few hundred million from Atlantic City.  Additionally, the IPO of MGM Macau should generate some liquidity for MGM Macau and potentially MGM.

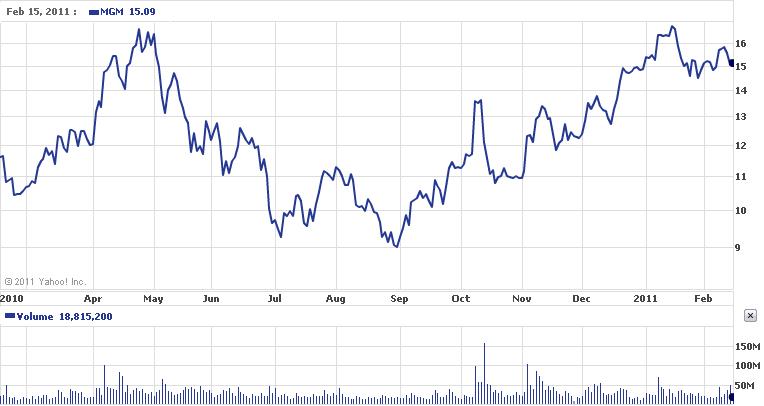
Still, valuation remains an issue.  The stock is trading at approximately $14 per share. With 489 million shares, the market capitalization is $6.8 billion.  Add to that $12.5 billion of net debt (including off balance sheet), the TEV is $19.3 billion, which equals 19.3x 2010 EBITDA of $1 billion and 16.1x EBITDA of $1.2 billion.

However, assuming MGM can generate $1.5 billion of EBITDA, which should be achievable in 2012/2013 and a 13x multiple and pay down $1 billion of net debt, the shares should trade up to approximately $16.50 (18% increase).

Looking further into the future (3-5 years), MGM could generate $2 billion of EBITDA and reduce net debt to $10 billion.  In this case, even a 12x TEV / EBITDA multiple would generate a stock price of $28.50, which is 2x the current share price.

MGM continues to face challenges, but over time its performance should improve.  Any improvement will be highly sensitive to the general economy, for better and for worse.  MGM's operational and financial leverage provide an attractive play on the economic recovery with a potential for a 2x return in 3-5 years.


Wednesday, February 16, 2011

Portfolio Review - February 16, 2010

Welcome to the Soha blog.  I am launching this blog to add another layer to my investing process for the portfolio that I established two years ago.  In general, I write detailed reports on the companies that I invest in, but also want to write about these companies on a less formal and ongoing basis.  Over time I will incorporate more of my detailed analysis in this blog, but I am beginning with a general overview of my current portfolio.

Blueknight Energy Partners (BKEP)

Blueknight is my largest position, representing 19% of the portfolio.  The company is a midstream oil and gas company that operated pipelines and storage facilities, mainly in Cushing, Oklahoma.  Blueknigh is undergoing a recapitalization after experiencing several changes in the past two years.  Blueknight was formed as a public subsidiary of Semgroup LP with the intention of Semgroup dropping down assets into Blueknight.  However, when Semgroup LP filed for bankruptcy, it lost control of Blueknight's GP.  These events led Blueknight to a technical default on its credit agreements and the loss of significant revenue generated by agreements with Semgroup LP.  More recently, Vitol acquired Blueknight's GP and the company has been working on stabilizing its business.  In late 2010, Vitol sold half of the GP to Charlesbank, a private equity fund, and together with Charlesbank proposed a series of recapitalization transactions.  The terms of the recapitalization were contested by three funds that own approximately 40% of the common units on the grounds that the deal was unfair to the common unit holders.  I fully agree with this view.  My investment thesis is based on the company completing its recapitalization, on modified terms, and continuing to improve its business to regain lost revenue.


Proshares Short S&P 500 (SH)

My second largest position is an inverse (or short) ETF on the S&P 500.  This position represents 16% of the portfolio.


Makhteshim Agan Industries (MAIXF)

Makhetshim Agan is an Israeli producer of generic crop protection products.  This position represents 12% of the portfolio.  The company recently received an offer to take the company private for approximately NIS 20 per share, which translates into $5.43 per share based on the current exchange rate.  The deal is expected to close in one or two quarters.  Given the uncertainty regarding the deal (the price was already reduced once) and the uncertainty in the exchange rate, I am looking to sell the shares at a small discount to $5.43; however, with the stock at $5.01, the discount is too large and I am waiting for the stock to reach the $5.20 range.

Macquarie Infrastructure Company (MIC)

Macquarie Infrastructure Company, which represents 10% of the portfolio, is a listed infrastructure fund.  MIC has emerged from the troubles it had during the financial crisis in 2008/2009 when it was caught with too much debt and a cyclical downturn in its aviation services business as air travel volumes declined.  However, the company has benefited from strength in its oil storage business.  When the downturn began, the company suspended its distribution; however, I expect the company to resume distributions, at lower levels, in the next one to two quarters.  The ongoing deleveraging, resumption of distributions and growth of the distributions as the aviation services business continues to rebound will provide catalysts for the stock.  Importantly, the resumption of the dividend should bring back investors that look at MIC as a yield play, which are an important constituency for infrastructure stocks.


Semgroup Corp (SEMG)

Semgroup Corp, a midstream oil and gas company that recently emerged from bankruptcy, represents 10% of the portfolio.  As mentioned above, Semgroup Corp (formerly, Semgroup LP) filed for bankruptcy two years ago.  The bankruptcy was triggered by the trading activities of the management team, which has since been replaced.  Semgroup primarily is a midstream oil and gas company and trading was never a core part of its operations.  The company emerged from bankruptcy and began trading in November 2010.  I believe that the company was priced at an attractive level when it emerged from bankruptcy.  Post bankruptcy companies are often under-priced and under-followed, which can create opportunities for gains.


MGM Resorts International (MGM)

The Las Vegas casino operator, MGM, represents 9% of the portfolio.  MGM's business is correlated to the general economy and is not immune from recessions, as casinos may have been in the past.  MGM is the largest casino operator in Las Vegas and its financial performance declined significantly during the recent recession as fewer visitors vacationed in Las Vegas and businesses cut back on convention spending.  Furthermore, MGM is highly leveraged and faced liquidity issues.  At this point, MGM's balance sheet is improved after debt recapitalizations, equity fundraising and asset sales.  Although management has cut expenses significantly, its EBITDA for 2011 is projected to be 62% of peak EBITDA in 2006.  However, at this point in the cycle, MGM looks attractive.  The economic recovery has begun and trends in Las Vegas are less negative than in the past two years and are starting to turn positive.  Furthermore, after a period of significant new construction in Las Vegas, including by MGM with its CityCenter project, hotel room capacity  growth has slowed significantly, which should be a positive for the existing players in Las Vegas, especially MGM.  The investment thesis is based on a cyclical uptrend of the next couple of years which should increase EBITDA to pre-recession levels.  The high leverage will benefit shareholders as the company's performance improves.


General Motors Preferred (GMPRB)

When General Motors went public in 2010 after emerging from bankruptcy it issues preferred stock in addition to common stock.  The portfolio's position in GMPRB represents 9% of the total and I established this position shortly after GM's IPO.  The preferred shares are convertible into common and provide downside protection while also offering a dividend.  Based on my purchase price, the yield is greater than 4%.  GM is a play on an improving domestic economy and the company's strong position in the Chinese market.  Furthermore, I suspect that the IPO was a bit underpriced because of the large offer size, messy history and the government's desire to sell more in the aftermarket.  The GM preferreds provide a less risky way to play GM's upside and possible IPO underpricing.

Diana Containerships  (DCIX)

Diana Containerships was recently formed through a spinout from Diana Shipping (DSX).  I established the position in Diana Containerships after the spinout and it represents 6% of the portfolio.  Diana Containerships owns 2 containerships and intends to purchase additional vessels.  Diana Containerships is managed by the same team that manages Diana Shipping.  The management team is experienced, conservative and prudent and made appropriate decisions through the ups and downs of the dry bulk cycle.  Diana Containerships is a play on the recovering trends in the containership market (which are more promising than the dry bulk market) and management's ability to make prudent acquisitions.  Furthermore, currently the stock is trading at approximately a 10% discount to the NAV of its vessels (which were acquired as newbuilds in mid 2010) and pricing has come down from previous highs, so the downside in the stock should be limited.


Cash

The portfolio has 8% of its value in cash.


DISCLOSURE: I AM LONG BKEP, SH, MAIXF, MIC, SEMG, MGM, GMPRB, DCIX.